The C4 Model: From Attendee to Facilitator

(Originally drafted in December 2019 during my tenure at Xero. Republished here in February 2024 with updated context and removed proprietary references)
In late 2019, I attended a workshop at YOW! Melbourne run by Simon Brown, the creator of the C4 model. It turned out to be one of the most useful conference sessions I’ve ever been to.
What made it valuable wasn’t salesmanship – though you could be forgiven for initially wondering whether you were sitting through a pitch. Simon was excellent at explaining why the format exists, why other approaches tend to fall down, and what C4 offers compared to heavier alternatives like UML and BPMN.
But the deeper achievement of the workshop was something else entirely: it surfaced the real problem architects face when visualizing systems – namely, figuring out what level of granularity and abstraction to capture, and how to represent it consistently.

I walked out of that room convinced. And a while later, when I found myself in a position to do something about it at my workplace, I adapted Simon’s workshop and ran it myself – first in person, then remotely.
This is the story of both, and what I learned along the way.
Why diagramming is everyone’s hidden problem
Here’s a thought that stayed with me from Simon’s material: “Moving fast in the same direction requires good communication.”
When I went to run the workshop internally, I knew the exercise would expose exactly that. Across the organization, every team had its own terminology, its own notation, its own implicit level of abstraction. Some diagrams showed database tables; others showed entire business domains. Comparing solutions was impossible.
A comment from one of my attendees later summed up the discovery:
“The most eye-opening thing for me is how basically none of the architects there have a consistent way of drawing diagrams.”
That’s the moment things click for everyone. Diagrams exist to communicate – but when nobody draws them the same way, you spend more effort explaining your diagrams than debating your design. Information stays stuck in people’s heads.
“This doesn’t make sense, but we’ll explain it” becomes a ritual at every design review.
What the C4 model actually gives you
The C4 model is a hierarchy of diagrams at consistent levels of abstraction:
- Level 1 – System Context: Your system as a black box, its users, and the other systems it interacts with. Anyone in the business can read this one.
- Level 2 – Containers: The deployable units inside your system – web apps, APIs, databases – and the technology choices behind them.
- Level 3 – Components: The major building blocks inside each container.
- Level 4 – Code: Class-level detail, rarely worth diagramming by hand.
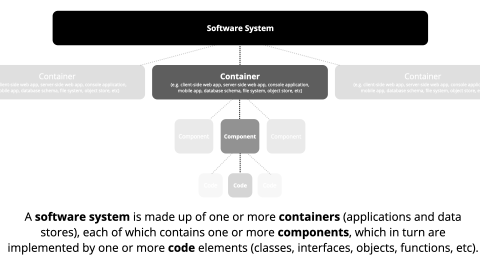
Crucially, much of this content is already freely available on the C4 website – Simon is generous that way. What the workshop adds is the experience of the transformation happening in real time. A couple of Simon’s lines from the day are worth repeating verbatim:
“A common set of abstractions is more important than a common notation.”
He illustrated this with two different maps of Melbourne: different styles, same entities, equally readable. That framing reframes the whole debate. The point isn’t winning an argument over boxes and arrows – it’s making sure everyone on the team shares a vocabulary for describing architecture.
And the philosophy that anchors it all: designing software is where the complexity should be, not communicating it.
If you’d rather hear all of this from Simon himself, this is the talk version of the workshop I attended – same material, same year, delivered at Agile on the Beach 2019:
The workshop format
Both Simon’s original and my adaptation follow a deceptively simple arc:
Start with everyone’s instincts. In groups, give people a fictional business problem – a “Financial Risk System” works well – and 90 minutes to draw architecture diagrams for it. No framework, no guidance. Then have groups share their diagrams with each other, with the reviewers explaining what they think the architecture does. Reviewers score on understandability, not on the solution itself.
This exercise never fails. Every group produces something reasonable, and every reviewer immediately spots the problem: the diagrams only make sense to the people who drew them.
Teach the model. Walk through the C4 levels, supplementary diagram types (dynamic diagrams for runtime behavior – “use dynamic diagrams to describe patterns or complex interactions” – and deployment diagrams for mapping containers to infrastructure), plus the tooling landscape from whiteboards to text-based tools like PlantUML.
Repeat the exercise with C4. Same kind of problem, but this time using System Context and Container diagrams. And here’s the payoff I saw both at YOW! and in my own sessions: almost every group converges on an identical solution with little to no variation between the resulting diagrams. When everyone uses the same abstractions, the diagram stops being about the diagrammer and starts being about the design. Richer diagrams lead to richer discussions, and similar levels of abstraction provide a way to easily compare solutions.
Close the loop. Run a “perfection game” on the before-and-after diagrams side by side. Seeing the difference between the ad-hoc diagrams and the C4 versions is the proof point that no amount of slides can deliver.
I ran this both as a full-day in-person session and split across two shorter virtual sessions. Both formats worked – remote delivery with shared whiteboard tooling turned out to be far less of a hindrance than expected.
What happened when I ran it
Across the sessions, I trained several dozen colleagues spanning a wide range of roles: product architects, solutions architects, principal engineers, platform architects, a head of engineering, even front-end specialists who assumed the material wouldn’t apply to them.
One of my favorite pieces of feedback came from someone in internal IT: “I initially thought that there wouldn’t be too much cross over with the style of work we do, but I was very wrong!”
The feedback came back strongly positive, with a few recurring themes:
- Learning by doing beats being lectured. The hands-on exercises were consistently called out as the most valuable part. “The primary use for diagrams and documentation is communication and learning” – the workshop itself proves the point.
- Cross-team collaboration was an unexpected benefit. People enjoyed working through problems with peers they rarely interacted with.
- The convergence sells itself. Watching independently-created diagrams come out nearly identical once everyone adopts the same abstractions is a genuinely memorable demonstration.
“Clear evidence of the benefit with the final diagrams being much better than the initial ones.”
“It gave me a chance to ’learn by doing’ and experience a very practical side of the decision-making process.”
Lessons worth sharing
1. Skip the framework debate. Is C4 better than UML, ArchiMate, or SysML? The wrong question. C4 optimizes for comprehension by a broad audience, not exhaustive specification. As Simon says, “when drawing architecture diagrams, think like a software developer.”
2. Address tooling head-on. Static diagrams rot. The real magic happens when you move from diagrams to models: text-based tooling versioned alongside your code, or tools that extract architecture from the codebase itself using architecturally-evident coding styles – annotations, naming conventions, module structures. As Simon puts it, “software architecture diagrams, when connected to the code, are also a fantastic tool for architectural improvement.”
3. Let narrative complement, not explain. A diagram that needs a paragraph of verbal clarification is a failed diagram. Any written narrative should sit alongside the diagram and deepen it, not decode it.
4. Plan for scale. When systems grow large: introduce nested abstractions, partition diagrams by business concept or vertical slice, or switch to alternative visualizations of the underlying model.
5. The workshop is a beginning, not an ending. Adoption is the real test. Follow up with engineering-focused sessions, document the process and outcomes, and give the practice champions who will carry it forward.
Final thought
When I sat in that YOW! workshop, I didn’t know whether C4 would end up as my organization’s modeling language of choice. What I did know was that it gave me plenty of food for thought – and, more practically, a ready-made template for a conversation my workplace badly needed to have.
Diagrams are maps. They exist to help developers navigate a large and complex codebase. But a map nobody else can read is just a sketch on a napkin. If your team is spending more effort explaining its architecture than designing it, a shared diagramming practice is one of the highest-leverage investments you can make.
And you don’t even need to fly to Melbourne. Start at c4model.com – Simon’s material is thorough, freely available, and designed to be adapted.
I did, and I’d do it again.
Related Posts
2024-02-18